S.A.T. I-Scholastic Assessment Test
The Scholastic Assessment Test is administered by the College Board. It began in 1958. The highest score is 800 and the lowest is 200 on each part; the three parts are: critical reading, mathematics and writing. An average score is between 400 to 530 on each part or 1200 to 1590 total. The PSAT is a practice test for the SAT I and is only given on two national dates in October (October 17 & 20 for 2007-54th annual National Merit Qualifying Exam). PSAT tests students in Critical Reading, Math and Writing with an index score between 60 and 240 which is used to qualify for the National Merit Scholarship Qualifying Test; 200 was the cutoff index score for Commended and 210 was the cutoff for Semi-Finalist in 2006 in Michigan. In 1998, over 19,000 high schools had over one million students participate, 15,000 were chosen as semi-finalists. 90% of the semi-finalists will become finalists based upon their SAT I score, academic record in high school, recommendation by school principal, and other criteria such as personal qualities, accomplishments and abilities that are considered important for success in rigorous college studies. There will be approximately 8,000 scholarships awarded to finalists with $2,500 per scholarship.

In order to register on-line or find more information, please contact the College Board or call 847-866-1700 or write: P.O.Box 6200 Princeton, NJ 08541-6200.
Michigan Chooses SAT over ACT for Class of 2016
National & State Report Archives
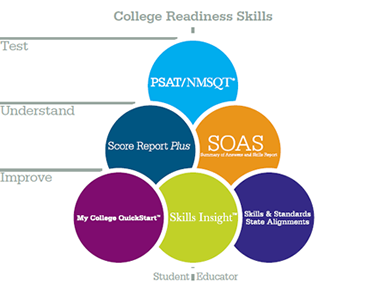
SAT Suite of Assessments: PSAT 8, 9 and 10

PSAT Prediction or Estimation of SAT I Scores in 11th grade based on 11th grade PSAT Subscores
| PSAT Score | SAT I Critical Reading Range | SAT I Math Range | SAT I Writing Range |
| 20 to 24 | 250 to 370 | 240 to 370 | 310 to 380 |
| 25 to 29 | 260 to 400 | 260 to 400 | 320 to 410 |
| 30 to 34 | 280 to 430 | 290 to 430 | 330 to 450 |
| 35 to 39 | 320 to 470 | 330 to 470 | 350 to 490 |
| 40 to 44 | 360 to 510 | 370 to 510 | 390 to 540 |
| 45 to 49 | 410 to 550 | 420 to 560 | 430 to 590 |
| 50 to 54 | 460 to 600 | 460 to 600 | 470 to 630 |
| 55 to 59 | 510 to 650 | 510 to 650 | 510 to 680 |
| 60 to 64 | 550 to 690 | 560 to 690 | 550 to 720 |
| 65 to 69 | 600 to 740 | 600 to 740 | 590 to 750 |
| 70 to 74 | 650 to 780 | 640 to 770 | 630 to 780 |
| 75 to 80 | 690 to 800 | 680 to 790 | 670 to 800 |
Mean or Average PSAT Score History
| Year | Critical Reading | Math | Writing Skills |
| 2007 | n/a | n/a | n/a |
| 2006 | 47.5 | 48.5 | 45.7 |
| 2005 | 47.5 | 49.2 | 49.3 |
| 2004 | 47.0 | 48.9 | 50.5 |
| 2003 | 47.2 | 48.1 | 49.8 |
| 2002 | 48.0 | 49.2 | 48.8 |

| Income | ACT | SAT I-Verbal | SAT I-Math | SAT I-Total | Income |
| $100,000+ | 23.5 | 553 | 562 | 1115 | $100,000+ |
| $80-100,000 | 22.5 | 527 | 530 | 1057 | $80-100,000 |
| $60-80,000 | 21.9 | 515 | 518 | 1033 | $70-80,000 |
| $50-60,000 | 21.3 | 507 | 510 | 1017 | $60-70,000 |
| $42-50,000 | 20.9 | 501 | 504 | 1005 | $50-60,000 |
| $36-42,000 | 20.4 | 493 | 496 | 989 | $40-50,000 |
| $30-36,000 | 19.9 | 478 | 482 | 960 | $30-40,000 |
| $24-30,000 | 19.4 | 459 | 467 | 926 | $20-30,000 |
| $18-24,000 | 18.7 | 440 | 457 | 897 | $10-20,000 |
| <$18,000 | 18 | 422 | 450 | 872 | <$10,000 |
| No Response (23%) | 21.1 | n/a | n/a | n/a | No Response(42%) |
| All (1.17 million) | 20.9 | 508 | 518 | 1026 | All (1.42 million) |
| Male (44%) | 21 | 512 | 537 | 1049 | Male (46.2%) |
| Female (56%) | 20.9 | 504 | 501 | 1005 | Female (53.8%) |
| American Indian/Alaskan Native | 18.8 | 483 | 488 | 971 | American Indian/Alaskan Native |
| Asian-American/Pacific Islander | 21.8 | 507 | 577 | 1084 | Asian, Asian-American or Pacific Islander |
| African-American/Black | 17.1 | 430 | 427 | 857 | African-American/Black |
| Mexican-American/Chicano or Latino | 18.4 | 451 | 458 | 909 | Mexican or Mexican-American |
| Other Hispanic: Cuban, Puerto Rican | 18.8 | 461 | 465 | 926 | Other Hispanic or Latino |
| Caucasian: American, White | 21.8 | 528 | 531 | 1059 | White |
| Multiracial | 20.9 | n/a | n/a | n/a | n/a |
| Other | 19.4 | 494 | 508 | 1002 | Other |
| Prefer not to respond (3%) | 22 | n/a | n/a | n/a | n/a |
| No Response (4%) | 20.7 | 522 | 535 | 1057 | No Response (19%) |
Sources: ACT, College Board, Fairtest.org based on 2004 score reporting
![]()
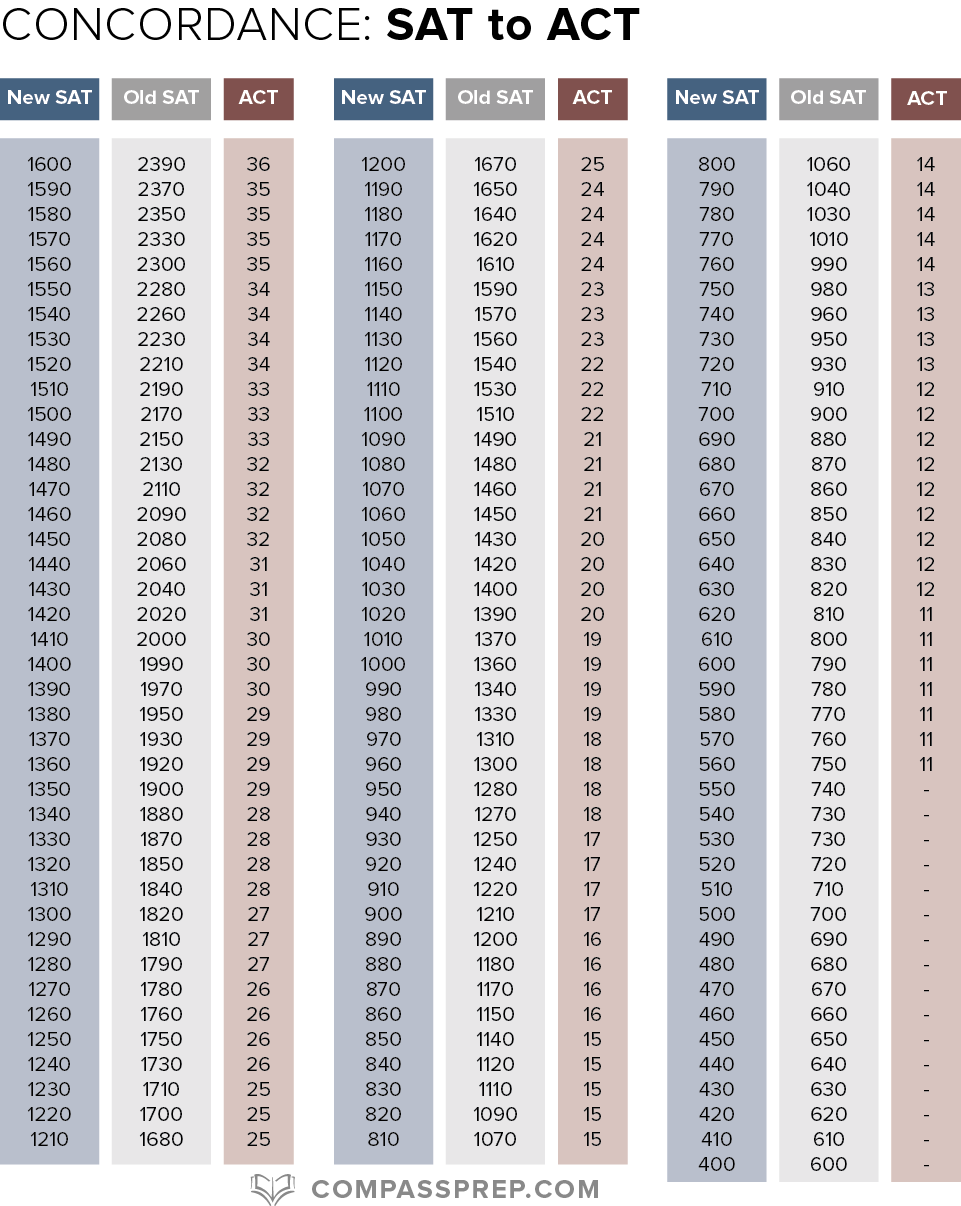
| SAT I Total Score |
Composite Score |
| 1600 | 36 |
| 1570 | 35 |
| 1510 | 34 |
| 1450 | 33 |
| 1390 | 32 |
| 1350 | 31 |
| 1310 | 30 |
| 1270 | 29 |
| 1230 | 28 |
| 1200 | 27 |
| 1160 | 26 |
| 1120 | 25 |
| 1090 | 24 |
| 1050 | 23 |
| 1010 | 22 |
| 970 | 21 |
| 930 | 20 |
| 890 | 19 |
| 840 | 18 |
| 800 | 17 |
| 750 | 16 |
| 700 | 15 |
| 630 | 15 |
| 570 | 13 |
| 510 | 12 |
| 450 | 11 |
| 410 | 10 |
| 400 | 1 to 9 |